Monitor System
This article introduces how to integrate the monitor system Grafana into the Zadig system.
# How to Integrate Grafana
# Step 1: Obtain the Grafana API Key
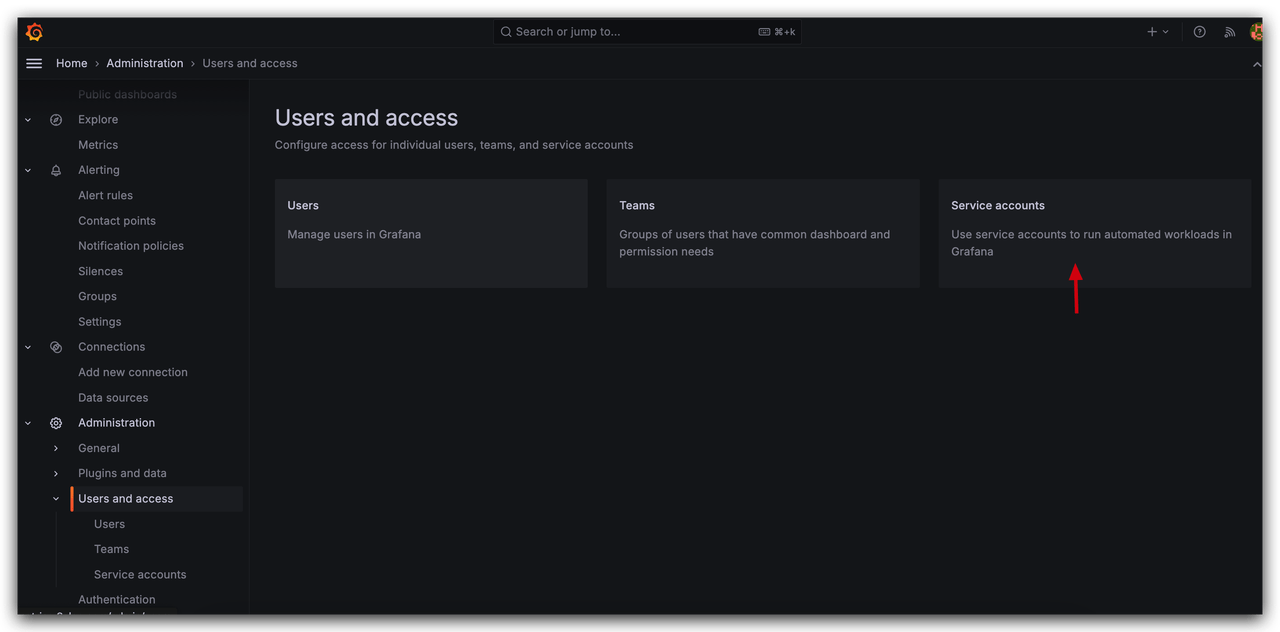
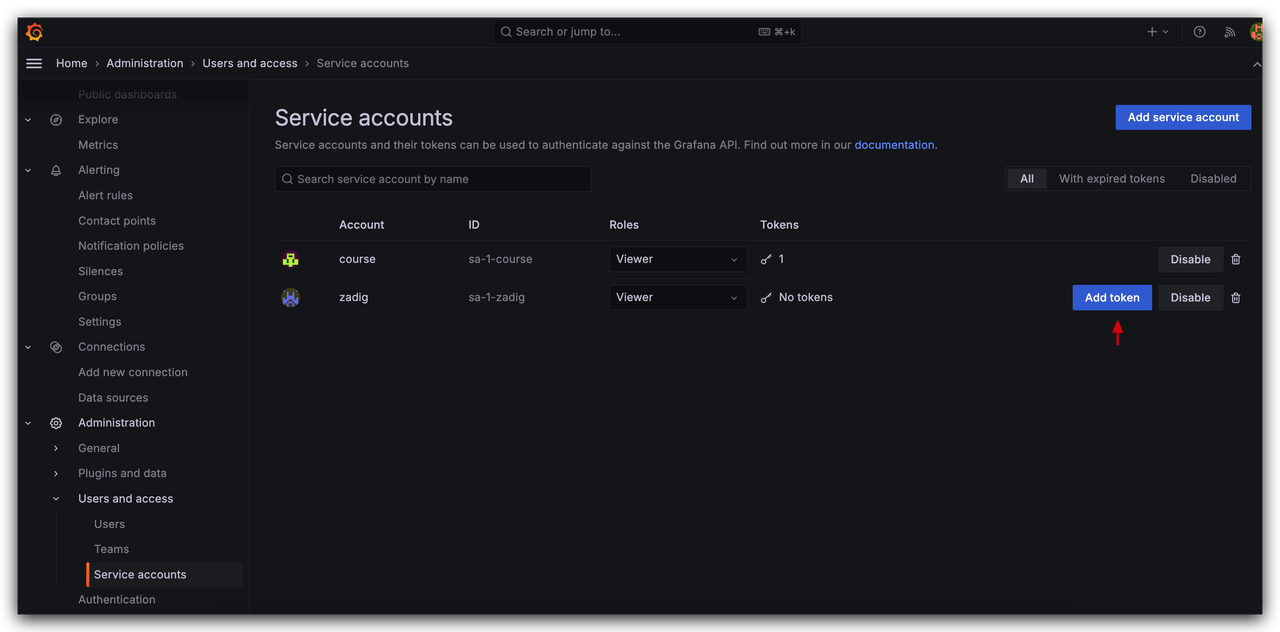
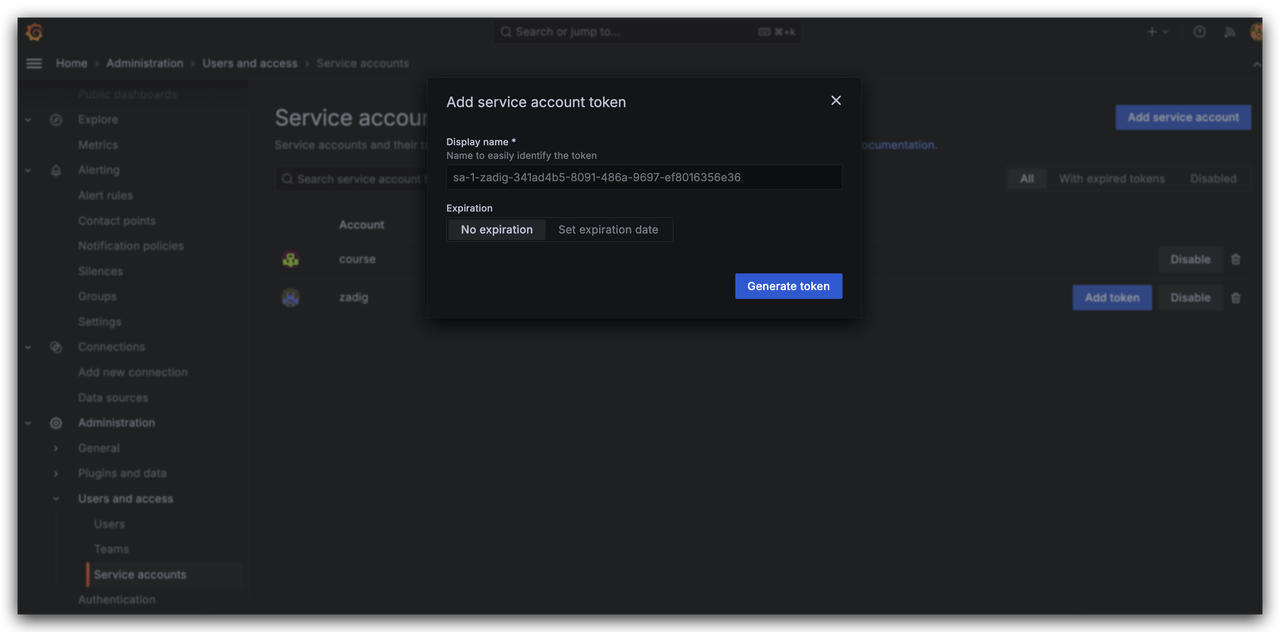
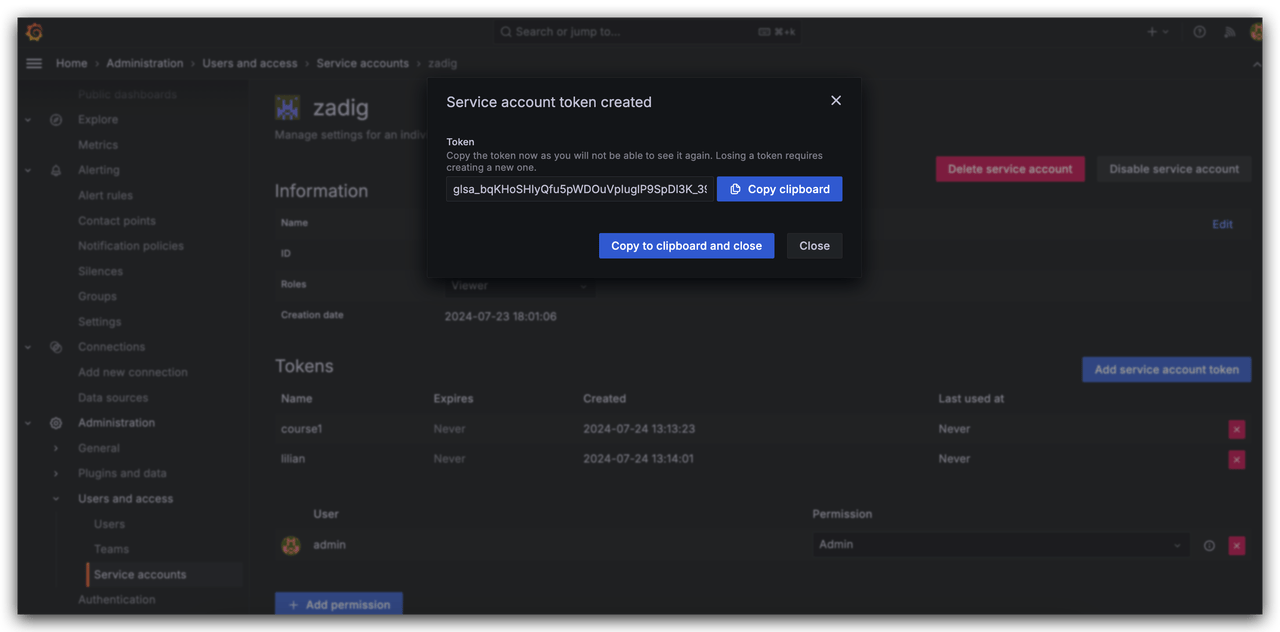
In Grafana, go to Configuration > Create Service Account, set the role to Viewer, and then add and obtain the Token.
# Step 2: Configure Grafana in Zadig
The system administrator should go to System Settings → System Integration → Monitoring System and add the relevant information for Grafana as shown below.
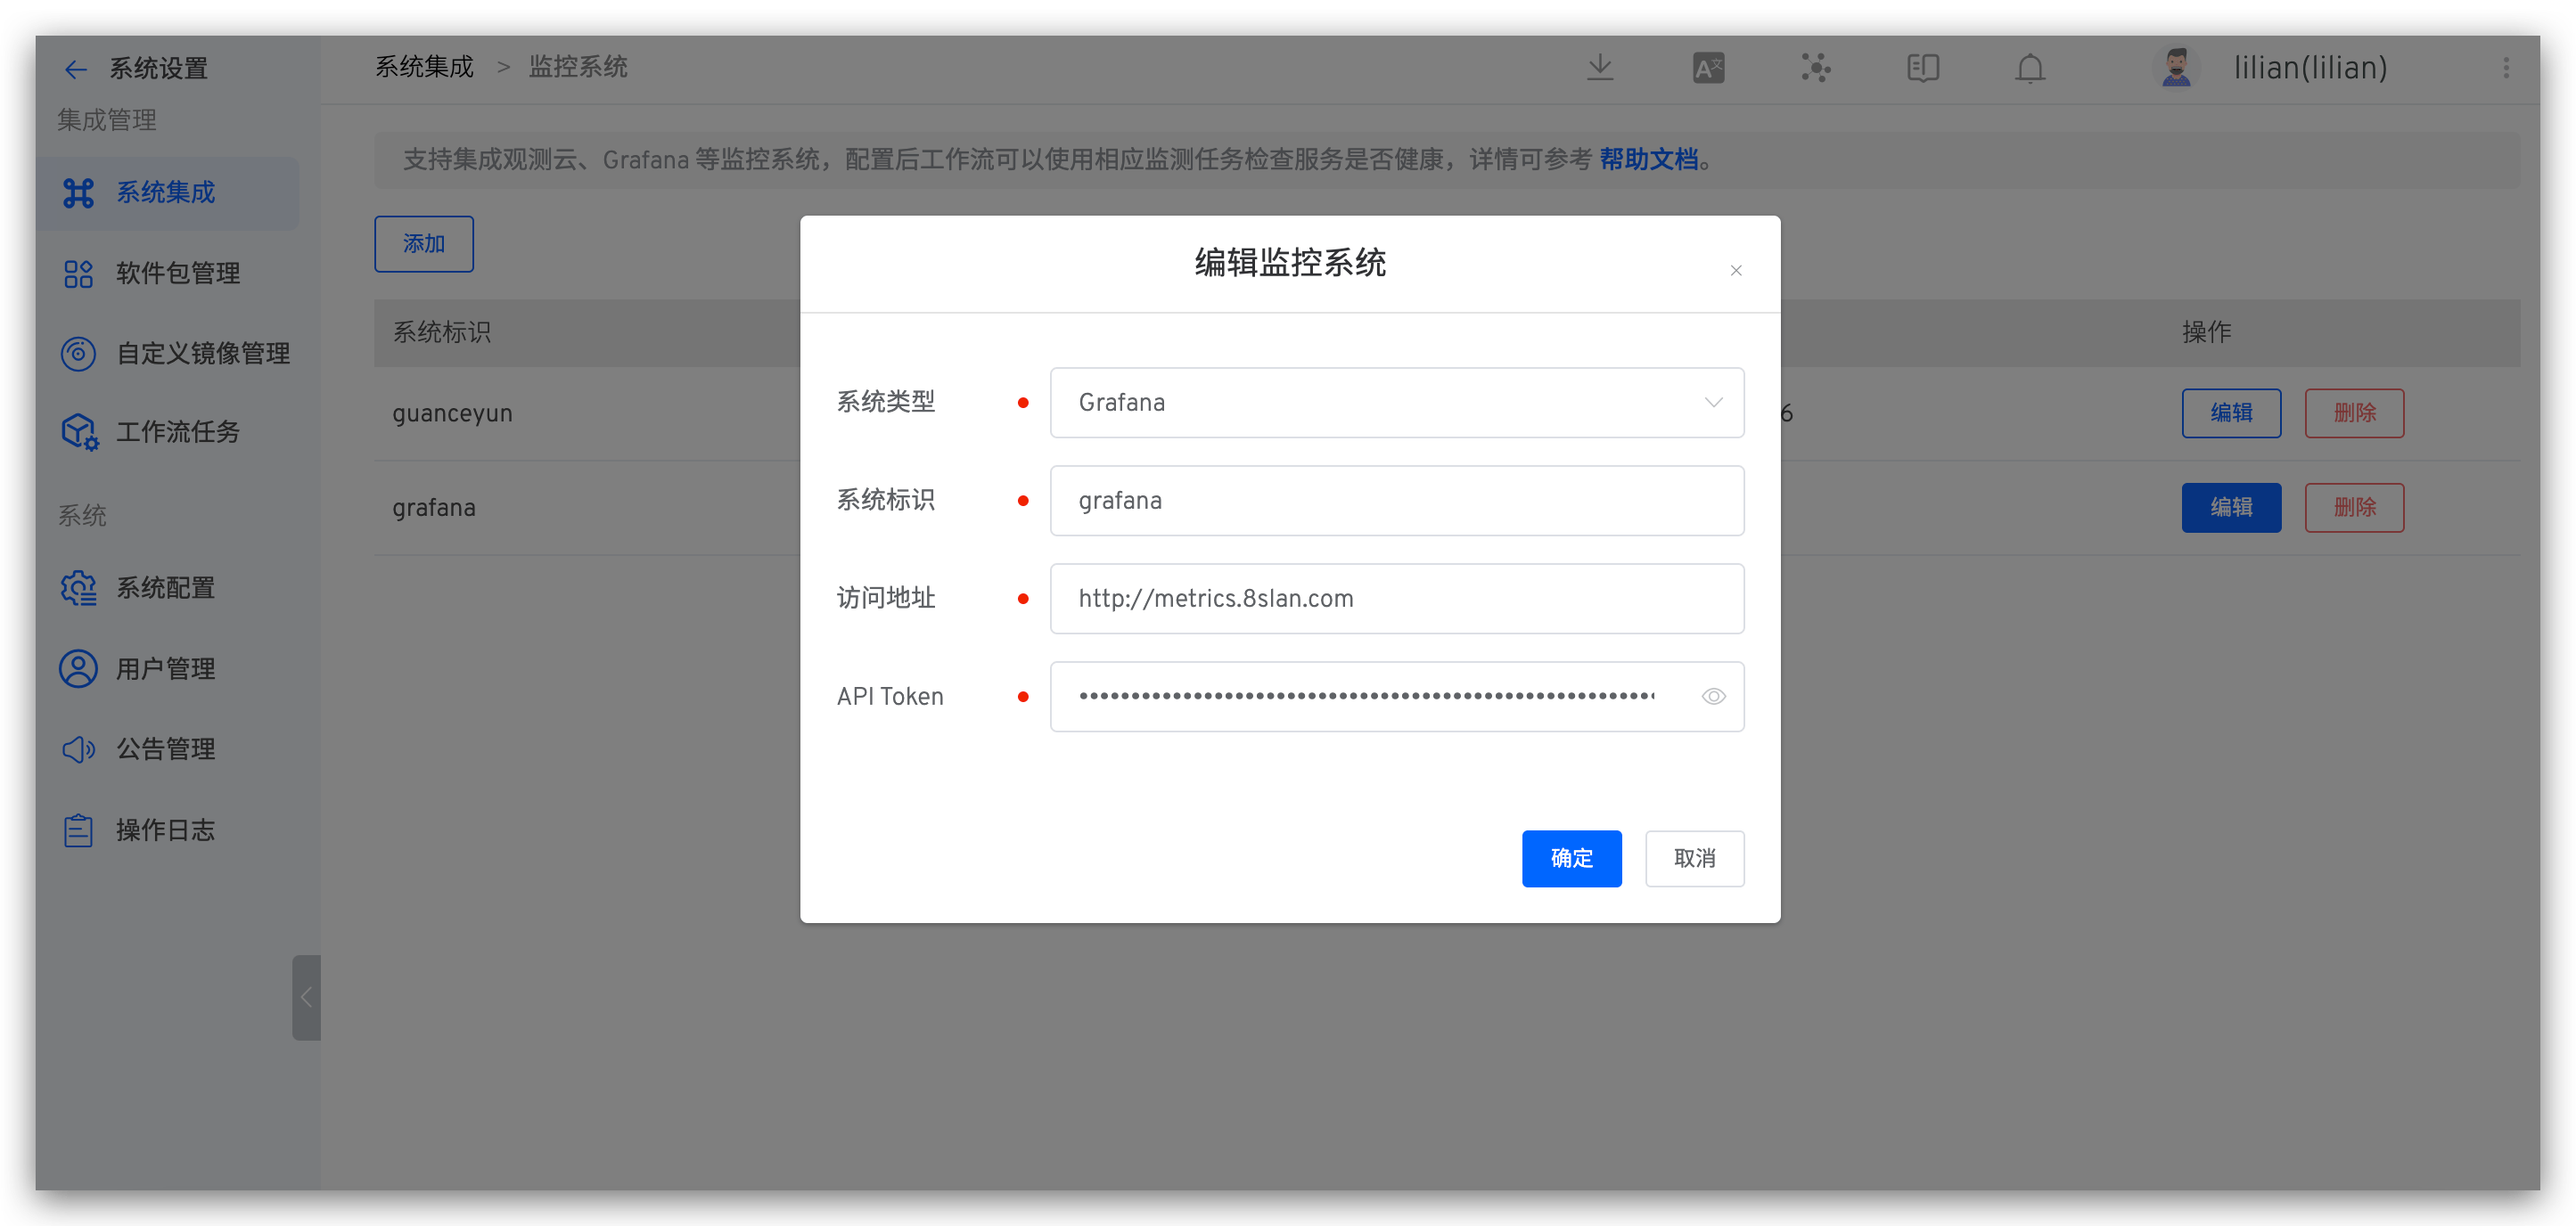
Parameter Description:
Type: SelectGrafanaSystem Identifier: Customize this to make it easy to quickly identify the system within the Zadig systemAddress: The Grafana access addressAPI Token: The API key obtained in Step 1
# How to Use Grafana
Configure Grafana Service Monitoring Task in a custom workflow to use Grafana Monitor whether the service is healthy, refer to Grafana .